Laying Out Information Displays Based On The Semantic Relatedness of Display Elements (2016)
Motivation
Masters Thesis, Human Factors and Applied Cognition, North Carolina State University
[The following description is a summary of my master's thesis. Click here for a full printable version (.pdf).]
Abstract
This research examined whether Kosslyn’s (1989) acceptability principles and Carswell and Wickens’ (1987) proximity compatibility principle could be extended, or adapted, to another type of display, the food item package. We hypothesized that a food package on which label items had been arranged according to their similarity, or semantic relatedness, would facilitate better user performance than a package on which label items had been arranged in other ways. Participants rated the semantic relatedness of 12 label items and we subjected these similarity/proximity ratings to multi-dimensional scaling (MDS) analyses. Using the MDS outputs, we created three (3) alternative versions of a common food item package: 1) Similarity version—label elements that received higher similarity ratings were depicted closer together than elements with lower similarity ratings, 2) Dissimilarity version—elements that received higher similarity ratings were depicted farther apart than elements with lower similarity ratings, 3) Random version—rating values were randomly assigned to the pairs of elements. We tested user performance on search tasks and integrative tasks on each of the three (3) versions. We hypothesized that the Similarity version would produce the best user performance and the Dissimilarity version would produce the worst. Results only partially supported this hypothesis. On the search tasks, the best performance was achieved on the Similarity and Dissimilarity versions, and the worst on the Random version. On the integrative tasks, the version made no difference in performance. Possible reasons for these results are discussed. Similar results by Fitts and Deininger (1954) and Morin and Grant (1955) suggest that performance on perceptual-motor tasks is superior when the Stimuli-Response relationships are in an ordered structure rather than randomly assigned, possibly because ordered structures make possible the development of search strategies, whereas random arrangements do not.
Procedure
We conducted this study in two phases. In Phase 1: Creating the layouts, we created the layouts based on semantic relatedness of elements on the layout. In Phase 2: Testing the layouts, we tested the layouts for the effects of semantic relatedness on performance.
Phase 1: Creating the layouts
Before we could create the layouts, we had to determine the elements that we would include in them, and we had to develop a method for determining the degree of semantic relatedness between those elements. An informal census of local supermarkets yielded the following list of twelve items that commonly appear on food item packages: batch number, choking hazard, company logo, manufacturer's contact information, cxcluded items (e.g. sugar, gluten), expiration date, flavor, ingredients, nutrition facts, opening instructions, product logo, universal product code.
We developed a computer program that displayed the twelve elements to participants, two at a time, and we established the degree of semantic relatedness between these pairs by asking participants to rate their similarity. Among the twelve elements, there were sixty-six (66) possible unique pairings. Participants were shown each of the 66 pairings, one at a time, and asked to rate the similarity between the elements in the pair on a scale of zero to ten. Zero (0) indicated that the elements were least similar, and ten (10) indicated that the elements were most similar. We collected similarity ratings from 86 participants and used these ratings to calculate mean similarity for all 66 pairings.
We analyzed the results of the similarity ratings with the multidimensional scaling (MDS) tool in SPSS. The MDS tool uses the similarity ratings as inputs for an algorithm that generates a spatial representation consisting of a geometric configuration of points. The geometric configuration reflects the proximity values between elements. Each point on the configuration corresponds to one stimulus element. SPSS generated the MDS solutions depicted below.

MDS - Similarity
Elements that received higher similarity ratings are depicted closer together than elements with lower similarity ratings

MDS - Dissimilarity
Elements that received higher similarity ratings are depicted farther apart than elements with lower similarity ratings

MDS - Random
Rating values are assigned randomly to the pairs of elements
We then chose a Hall’s lozenge package as a representative example of a typical consumer goods package and created three versions of the Hall's layout based on the three MDS configurations. Each layout was arranged so that the elements on them corresponded to their relative position on each of the three MDS solutions. The Hall's packages are shown below with the MDS configurations superimposed on them.

Similarity_Superimposed
"Similarity" version of the Halls layout with the Similarity MDS solution superimposed

Dissimilarity_Superimposed
"Dissimilarity" version of the Halls layout with the Dissimilarity MDS solution superimposed

Random_Superimposed
"Random" version of the Halls layout with the Random MDS solution superimposed
The final appearance of the three layouts is shown below.

Similarity

Dissimilarity
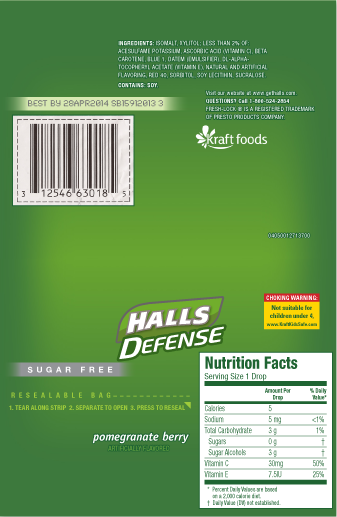
Random
Phase 2: Testing the layouts
We developed two tasks to test the layouts: 1) Search 2) Integration.
1) Search for semantically related/unrelated items – We used the application programming interface (API) for survey software, Qualtrics, to develop an interactive search task to test whether there was any difference between the three layouts—Similarity, Dissimilarity, Random—in participants’ response times in searching for elements on the layout. Participants completed a familiarization section in which he/she was shown the 12 elements from Table 1. Then the participant was shown instructions informing them which element they should search for on the trial that was about to begin (e.g. EXPIRATION DATE), and that clicking on a gray box would display the layout and begin the trial.
The expiration date in the preceding instructions was the “orientation” element. When the participant clicked the gray box, a clock started and one of the 3 layouts—Similarity, Dissimilarity, Random—appeared. The participant located the orientation element from the preceding instructions and clicked on it. The clock stopped and the elapsed time was recorded. All elements on the layout were clickable, as was the background, so it was possible for the participant to click on the wrong element. When the participant clicked on the orientation element, a black screen obscured the layout and instructions appeared directing the participant which layout element (e.g. KRAFT FOODS) to search for when the next screen appeared. Clicking the OK button made the next screen appear.
The box containing these instructions and the OK button were centered directly on top of the orientation element, and the black screen obscured the rest of the layout so that no part of the layout was visible until the participant clicked the OK button. The KRAFT FOODS logo was the “target” element. When the participant clicked the OK button, the layout reappeared, the clock resumed, and the participant searched for the target element. The participant located the target element and clicked on it. The clock stopped, and the elapsed time was recorded. A gray box appeared congratulating the participant on his/her completion of the practice session and that they should click the red next button to begin the actual sessions. When the participant clicked the red next button, they were presented with sessions very similar to the practice session. Each of the 12 elements on the layout was used as an orientation element in two searches for a total of 24 searches. The 12 orientation elements were presented in random order to each participant using a randomization algorithm in the Qualtrics API. The target elements in each search were chosen for the degree of their relatedness to the orientation element, one having a high relatedness rating to the orientation item, the other having a low relatedness rating to the orientation item. This meant that two searches were conducted from each element on the layout—for an element that was highly related to the orientation element and for an element that was less highly related to the orientation element. Participants were randomly assigned to one of the three layouts—Similarity, Dissimilarity, Random—at the beginning of the trial using a randomization algorithm in the Qualtrics API. Once the layout was assigned, it did not change, so participants who received the Similarity layout, for example, performed all 24 search sessions on the Similarity layout.
2) Integration task – We developed three (3) integration tasks. Each integration task required that the participant retrieve and integrate information from a combination of elements on the layout to complete the task successfully. We named the integration tasks 1) Kraft, 2) Doctor, and 3) Sugar. Two measures were recorded from each integration task: 1) whether the participant correctly completed the task. 2) The amount of time that it took to complete the task. The order of presentation of these integration tasks was counterbalanced to prevent order effects. However, we did not counterbalance the search task portion of the experiment with the integration portion of the experiment. In order to prevent the search task results becoming contaminated by participants’ familiarity with the layout, we decided that all participants would perform the 30 search tasks before they performed the integration tasks.
Participants. We used the Internet polling site, Mechanical Turk, to solicit 90 participants using the same screening criteria as in Phase 1. Of the 90 participants, two missed the target items in the search section more than 50% of the time, so we excluded their data from our analyses. This left us with data from eighty-eight (88) participants.
Results
Search task – We compared the three layout conditions to see whether layout condition affected participants’ response times on the search task. The three layout conditions yielded similar overall mean search times (Similarity = 3.16 sec; Dissimilarity = 3.13 sec; Random = 3.16 sec) and response times did not vary significantly; F(2, 2005) = 2.20, p=.11, η2 =.002. All three conditions showed very high accuracy (Similarity=96%, Dissimilarity=97%, Random=96%, Total accuracy = 96%). The differences in accuracy were not significant by a Chi Square test (df=2, Chi Square=1.1, p> .05).
We also conducted an analysis of a multiple regression model (LOG10RT = a + b1(Layout) + b2(Semantic Relatedness) + b3(Layout*Semantic Relatedness) to determine the interaction between the two independent variables, layout and semantic relatedness, on participants’ response times on the search task. The values for Semantic Relatedness in the regression model were supplied by participant ratings described earlier. Results showed that there was no significant main effect of layout or semantic relatedness on response times. However, there was a significant interaction between layout and semantic relatedness F(8, 1993) = 2.49, p= .01.

Similarity
Search Time = 3.2 – .013 (RU_A)
t (df = 1)=-1.973, p < .05
r2=.006

Dissimilarity
Search Time = 3.2 – .014 (RU_A)
t (df = 1)=-2.231, p < .05
r2=.007

Random
Search Time = 3.1 + .008 (RU_A)
t (df = 1)=1.377, p = .17
r2=.003
Integration tasks – A 3 x 3 (3 layouts x 3 tasks) analysis of variance revealed no significant differences between layouts in response times on the integration tasks, F(2, 255) = .386, p = .68. All three conditions showed high accuracy (Similarity=84%, Dissimilarity=92%, Random=93%, Total accuracy = 89%), although slightly lower than for the search task. The differences between conditions in the integration task were not significant by a Chi Square test (df=2, Chi Square=4.7, p > .05).
Additionally, there was no significant interaction between layout and question in response time, F(4, 255) = .197, p= .94. This analysis included both incorrect and correct answers. An additional 3 x 3 analysis of variance that included only correct answers to the integration tasks also revealed no significant differences between layouts in response times on the integration tasks, F(2, 255) = .478, p= .62, and there was no significant interaction between layout and question, F(4, 255) = .288, p= .89.
Discussion
The results suggested that performance is superior when relationships are in some kind of ordered structure rather than randomly assigned. With the Similarity and Dissimilarity layouts, the two layouts in which the arrangement of elements was mapped to semantic relatedness or in reverse of it, search task performance improved as the semantic relatedness of the items on the layouts increased. However, on the Random layout, search task performance did not change as semantic relatedness increased. These results only partially support the hypothesis that performance on search tasks would be better on layouts where the arrangement of elements (syntax) is mapped to semantic relatedness. The hypothesis suggested that performance on search tasks would be better on layouts where the arrangement of elements (syntax) is mapped to semantic relatedness than on layouts where elements are arranged randomly, or in reverse of semantic relatedness. Consequently, a layout with highly related elements placed far apart, as in the Dissimilarity condition, should produce the worst search task performance, but the data show that this was not the case.
Results such as the above are not unprecedented. Fitts and Deininger (1954) found that performance on perceptual-motor tasks was influenced by the degree of correspondence between the stimulus and response sets as measured by the degree to which S-R relationships corresponded to “population stereotypes” (p. 491). Fitts and Deininger varied the degree of S-R correspondence by creating three correspondence conditions: 1) maximum, 2) mirrored, and 3) random correspondence. In the maximum correspondence condition, stimuli were mated with responses to provide “maximum agreement with population stereotypes” (p. 486). This resembles the Similarity condition in the present research. In the mirrored correspondence condition, “S-R mating consisted of reversing the left-right relations in the maximum correspondence” (p. 485) such that these S-R relationships were now in reverse of those in the maximum correspondence condition. This is analogous to the Dissimilarity condition in the present research. In the random correspondence condition, stimuli were randomly assigned to responses as they were in the Random condition of the present research. Fitts and Deininger found that performance in the maximum and mirrored conditions was superior to performance in the random condition, suggesting that performance on perceptual-motor tasks is superior when the S-R relationships are in some kind of ordered structure rather than randomly assigned.
Morin and Grant (1955) had similar findings. Participants made key-pressing responses to light stimuli under nine degrees of correspondence between light and keys represented by the following values: +1.00, +0.86, +0.57, +0.29, 0.00, -0.29, -0.57, -0.86, and -1.00. The value +1.00 indicated direct correspondence between the light stimuli and the key press responses, much like Fitts and Deininger’s (1954) maximum correspondence condition and the Similarity condition in the current study. The value of -1.00 indicated that the display-control relationships between light stimuli and key presses was the reverse of that in the +1.00 condition, much like Fitts and Deininger’s mirrored condition and the Dissimilarity condition in the current study. The value 0.00 indicated no ordered relationship at all between the light stimuli and key press responses, much like the random conditions in the other studies. Like the researchers in the present study, Morin and Grant, predicted that “performance should be best for a correlation of +1.00 and show progressively more degradation as the correlation approaches -1.00” (p. 40), suggesting a relationship similar to the one implied by H1 in the present research: +1.00 > 0.00 > -1.00. They found instead that “… a complete reversal of display-control relationships (τ = -1.00) yields better performance than do the more irregular rearrangements (-.86 ≤ τ ≤ +.86)” leading them to conclude that a subject “responds readily to orderliness, direct or reversed (high positive or negative values of τ)” (p. 45). Morin and Grant’s findings, like those in Fitts and Deininger’s and the present research, again suggest that performance is superior when the S-R relationships are in some kind of ordered structure rather than randomly assigned.